With the world recently experiencing the four hottest days in recorded history, tools to help the transition to net zero and mitigate the effects of the climate crisis are more needed than ever.
According to Sam Hashemi, CEO of cloud-native GIS (Geographic Information Systems) mapping software company Felt, central to helping businesses assess risk, track emissions, anticipate renewable capacity and communicate this to clients is a shareable and interactive mapping tool.
Go deeper with GlobalData

“We have an immense amount of data about the Earth,” explains Hashemi, “but to actually change anything about the climate, we have to turn that data into meaning, and that’s where maps, in particular, play a very critical role.”
With the latest version of Felt, Hashemi hopes it will help businesses communicate valuable information to assist with tracking emissions, renewable energy capacity and real-time information on adverse weather events.
Felt 3.0
After selling his previous business, a city planning software company called Remix, Hashemi realized that the problem of maps being difficult to work with, when maps are a key part of many businesses, is an industry-wide problem.
He notes that while there are traditional tools that are quite powerful, these platforms can be quite inflexible, so Felt set out to build a modern cloud-native GIS stack for the business community.
How well do you really know your competitors?
Access the most comprehensive Company Profiles on the market, powered by GlobalData. Save hours of research. Gain competitive edge.

Thank you!
Your download email will arrive shortly
Not ready to buy yet? Download a free sample
We are confident about the unique quality of our Company Profiles. However, we want you to make the most beneficial decision for your business, so we offer a free sample that you can download by submitting the below form
By GlobalDataTwo years after its founding, in July this year, Felt announced the latest version of its software, Felt 3.0, which has fully customizable dashboards and integrates with existing business systems such as Postgres, Snowflake or Big Query.
Hashemi explains that Felt has a huge variety of use cases, with uptake from journalists at media firms such as ABC and the New York Times, to startups using it to manage locations of tractors or oil wells or progress on solar panels as well as consultants utilising it to demonstrate geospatial stories.
Shareable, interactive, and compatible
The key features differentiating Felt’s product from other mapping platforms are its shareability, interactivity and universal compatibility.
Traditionally mapping systems have been quite desktop-based and difficult to share, however with Felt, Hashemi explains that to share the visualisation, a user can just add someone’s email to the top right corner of the page, allowing them instant access without having to download anything or set up an account.
The shareability of Felt, Hashemi believes, will be a great asset in the fight against climate change.
“Making these decisions collaboratively in a cross-organizational way is probably one of the big ways we’re going to be addressing the carbon issues over the next couple of decades, and so we unlock those traditional boundaries that are difficult to work with in other software,” adds Hashemi.
With full interactivity, users can also drill down and select specific areas on a map to understand the visualisations fully, while also being able to insert charts and other data to support the understanding of data.
Hashemi explains, that while GIS mapping has traditionally been relatively complex and inaccessible, Felt aims at trying to make it more democratic.
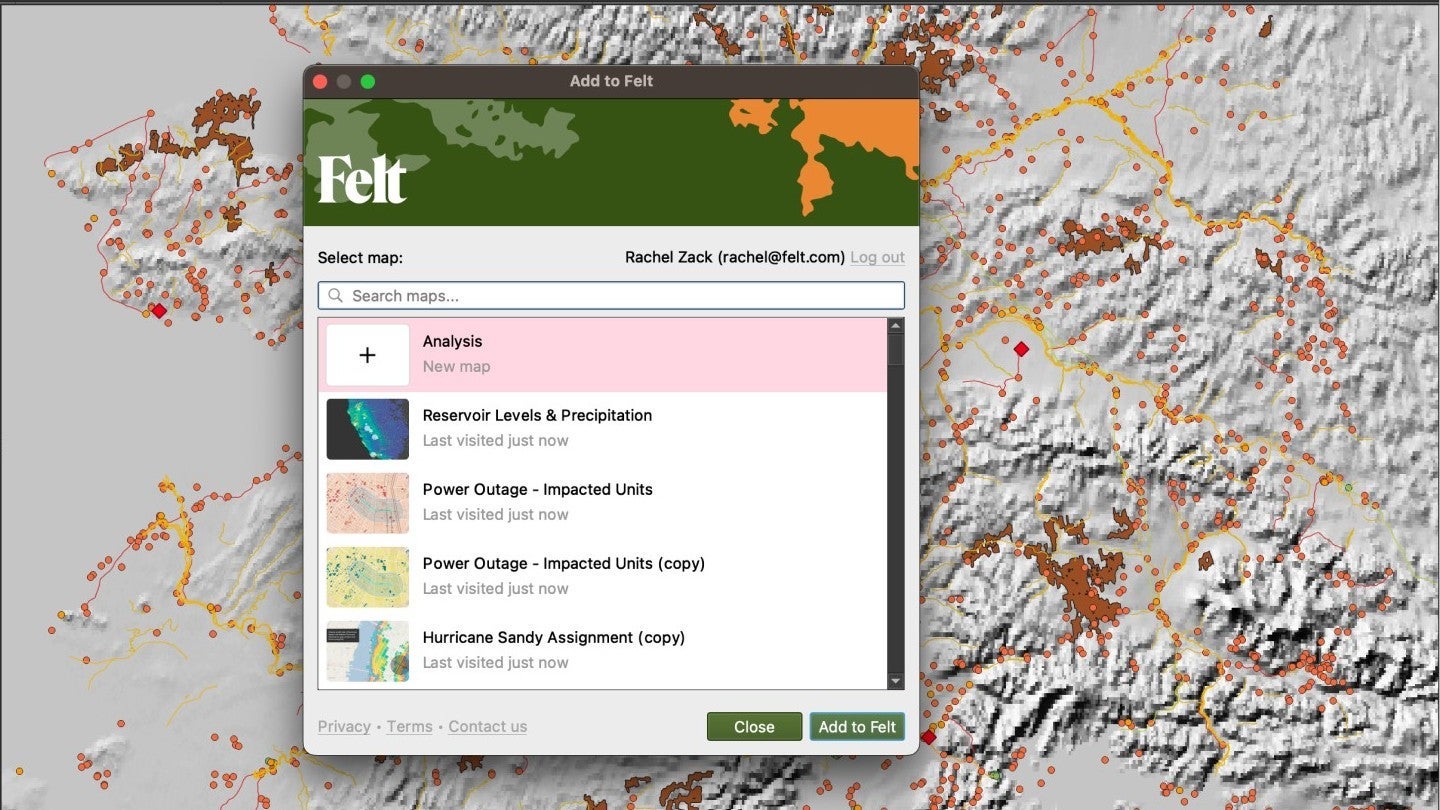
“Drag any file into Felt, I promise you any file, any geo package, shape file, CSV, raster file, and it automatically appears on a map, instantly,” he adds.
This allows employees from any level in an organisation to visualise geospatial data, which means experts can spend more time focussing on unique geospatial analysis and insight work.
Underpinning the system is a robust focus on cybersecurity. Felt has a SOC2 certification and is hosted on AWS East in the US, meaning it is secure and auditable. However, the company, appreciating the sometimes sensitive nature of geospatial data, also offers the option for firms to host sensitive data themselves.
Mapping and net zero
Hashemi believes that mapping platforms can help significantly on the road to net zero. One customer already using Felt’s platform to boost accountability for carbon emission reduction pledges is NatureQuant.
The firm pulls satellite imagery in over time and analyses it to understand the impact of carbon credit programs. This is then provided to customers as an auditing and verification tool. Hashemi explains that while previously it could be difficult to share this kind of geospatial data, Felt’s fully online and flexible nature makes it easy to do so.
Felt currently has a couple of interactive maps demonstrating its usability for climate-related mapping. One is a live fire map, displaying the location of every fire in the US with all the smog and smoke impact, which offers clear insights for emergency response teams requiring real-time information. As global warming creates more adverse weather events, real-time visualisations such as these will become increasingly necessary for emergency services.
Another map demonstrates a visualisation of energy sites in Pennsylvania, allowing a viewer to see wind turbines, power plants, coal mines, renewable energy sites and active natural gas wells, with the ability to select each energy site. Visualisations such as these allow stakeholders and potential investors to ascertain the energy sources available and decipher where investment is needed.
Hashemi adds that maps not only help to tell a story about how the Earth is changing but importantly help to envision a future that could be different. He continues: “The more folks we can rally around the story, the visualization and the understanding, the more likely we are to reach that net-zero goal, and so that’s why we set out on this mission of making maps way more accessible, effortless for everyone.”